Mark Dominus (陶敏修)
mjd@pobox.com

Archive:
| 2025: | JFM |
| 2024: | JFMAMJ |
| JASOND | |
| 2023: | JFMAMJ |
| JASOND | |
| 2022: | JFMAMJ |
| JASOND | |
| 2021: | JFMAMJ |
| JASOND | |
| 2020: | JFMAMJ |
| JASOND | |
| 2019: | JFMAMJ |
| JASOND | |
| 2018: | JFMAMJ |
| JASOND | |
| 2017: | JFMAMJ |
| JASOND | |
| 2016: | JFMAMJ |
| JASOND | |
| 2015: | JFMAMJ |
| JASOND | |
| 2014: | JFMAMJ |
| JASOND | |
| 2013: | JFMAMJ |
| JASOND | |
| 2012: | JFMAMJ |
| JASOND | |
| 2011: | JFMAMJ |
| JASOND | |
| 2010: | JFMAMJ |
| JASOND | |
| 2009: | JFMAMJ |
| JASOND | |
| 2008: | JFMAMJ |
| JASOND | |
| 2007: | JFMAMJ |
| JASOND | |
| 2006: | JFMAMJ |
| JASOND | |
| 2005: | OND |
Subtopics:
| Mathematics | 242 |
| Programming | 99 |
| Language | 95 |
| Miscellaneous | 72 |
| Book | 50 |
| Tech | 49 |
| Etymology | 35 |
| Haskell | 33 |
| Oops | 30 |
| Unix | 27 |
| Cosmic Call | 25 |
| Math SE | 25 |
| Physics | 21 |
| Law | 21 |
| Perl | 17 |
| Biology | 15 |
| Brain | 15 |
| Calendar | 15 |
| Food | 15 |


Comments disabled
Sun, 19 Nov 2006
A series of articles about Linogram
Every six months or so I do a little work on linogram, which for about
18 months now has been about one week of hard work short of version
1.0. Every time I try to use it, I am surprised by how pleased I am
with it, how easy I find it to use, and how flexible the (rather
spare) basic feature set is—all properties of a well-designed
system.
I was planning to write a short note about this, but, as always happens when I write about linogram, it turned into a very long note that included a tutorial about how linogram works, a rant about why it is a good idea, and a lot of technical examples. So I decided to break the 4,000-word article into smaller pieces, which I will serialize.
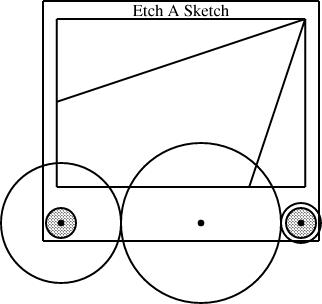
Most recently I used linogram to do schematic diagrams of an Etch-a-Sketch for some recent blog articles ([1] [2]). In case you have forgotten, here is an example:
Basic ideas of linogram
There are two basic concepts that provide the underpinnings of linogram. One is that most interesting features of a line drawing can be described by giving a series of linear equations that relate the positions of the components. For example, to say that line B starts at the same place that line A ends, one provides the two extremely simple linear equations:
        B.start.x = A.end.x;
        B.start.y = A.end.y;
which one can (and normally would) abbreviate to:
B.start = A.end;
The computer is very good at solving systems of linear equations, and can figure out all the things the equations imply. For example, consider two boxes, X and Y:
        X.ht = 2;     # height of box X
        Y.ht = 3;     # height of box Y
        X.s = Y.n;    # 's' is 'south'; 'n' is 'north'
From this, the program can deduce that the south edge of box Y
is 5 units south of the north edge of box X, even though
neither was mentioned explicitly.These simple examples are not very impressive, but please bear with me.
The other fundamental idea in linogram is the idea of elements of a diagram as components that can be composed into more complicated elements. The linogram libraries have a definition for a box, but it is not a primitive. In fact, linogram has one, and only one primitive type of element: the number. A point is composed of two numbers, called x and y, and is defined by the point.lino file in the library:
        define point {
          number x, y;
        }
A line can then be defined as an object that contains two points, the
start and end points:
        require "point";

        define line {
          point start, end;
        }
Actually the real definition of line is somewhat more
complicated, because the center point is defined as well, for the
user's convenience:
        require "point";

        define line {
          point start, end, center;
          constraints {
            center = (start + end) / 2;
          }
        }
The equation
center = (start + end) / 2 is actually shorthand
for two equations, one involving x and the other involving
y:
| center.x = (start.x + end.x) / 2 |
| center.y = (start.y + end.y) / 2 |
From the specification above, the program can deduce the location of the center point given the two endpoints. But it can also deduce the location of either endpoint given the locations of the center and the other endpoint. The treatment of equations is completely symmetrical. In fact, the line is really, at the bottom, an agglomeration of six numbers (start.x, center.y, and so forth) and from any specification of two x coordinates and two y coordinates, the program can deduce the missing values.
The linogram standard library defines hline and vline as being like ordinary lines, but constrained to be horizontal and vertical, and the then box.lino defines a box as being two hlines and two vlines, constrained so that they line up in a box shape:
        require "hline";
        require "vline";

        define box {
          vline left, right;
          hline top, bottom;
          constraints {
            left.start  = top.start;
            right.start = top.end;
            left.end    = bottom.start;
            right.end   = bottom.end;
          }
        }
I have abridged this definition for easy reading; the actual definition in the file has more to it. Here it is, complete:
        require "hline";
        require "vline";
        require "point";

        define box {
          vline left, right;
          hline top, bottom;
          point nw, n, ne, e, se, s, sw, w, c;
          number ht, wd;
          constraints {
            nw = left.start  = top.start;
            ne = right.start = top.end;
            sw = left.end    = bottom.start;
            se = right.end   = bottom.end;

            n = (nw + ne)/2;
            s = (sw + se)/2;
            w = (nw + sw)/2;
            e = (ne + se)/2;

            c = (n + s)/2;

            ht = left.length;
            wd = top.length;
          }
        }
The additional components, like sw, make it easy to refer to the corners and edges of the box; you can refer to the southwest corner of a box B as B.sw. Even without this convenience, it would not have been too hard: B.bottom.start and B.left.end are names for the same place, as you can see in the constraints section.
Tomorrow: The Etch-a-Sketch component.

More complete information about linogram is available in Chapter 9 of Higher-Order Perl; complete source code is available from the linogram web site.
[Other articles in category /linogram] permanent link