Mark Dominus (陶敏修)
mjd@pobox.com

Archive:
| 2026: | JFMAMJ |
| 2025: | JFMAMJ |
| JASOND | |
| 2024: | JFMAMJ |
| JASOND | |
| 2023: | JFMAMJ |
| JASOND | |
| 2022: | JFMAMJ |
| JASOND | |
| 2021: | JFMAMJ |
| JASOND | |
| 2020: | JFMAMJ |
| JASOND | |
| 2019: | JFMAMJ |
| JASOND | |
| 2018: | JFMAMJ |
| JASOND | |
| 2017: | JFMAMJ |
| JASOND | |
| 2016: | JFMAMJ |
| JASOND | |
| 2015: | JFMAMJ |
| JASOND | |
| 2014: | JFMAMJ |
| JASOND | |
| 2013: | JFMAMJ |
| JASOND | |
| 2012: | JFMAMJ |
| JASOND | |
| 2011: | JFMAMJ |
| JASOND | |
| 2010: | JFMAMJ |
| JASOND | |
| 2009: | JFMAMJ |
| JASOND | |
| 2008: | JFMAMJ |
| JASOND | |
| 2007: | JFMAMJ |
| JASOND | |
| 2006: | JFMAMJ |
| JASOND | |
| 2005: | OND |
In this section:
| An integer partition puzzle |
| Bernoulli processes |
| "Go ahead, throw your vote away!" |
| How big is a five-gallon jug? |
| Symmetric functions |
| The Spite House |
| Your age as a fraction |
Subtopics:
| Mathematics | 250 |
| Programming | 102 |
| Language | 97 |
| Miscellaneous | 75 |
| Book | 50 |
| Tech | 49 |
| Etymology | 36 |
| Haskell | 33 |
| Oops | 30 |
| Unix | 27 |
| Cosmic Call | 25 |
| Math SE | 25 |
| Law | 23 |
| Physics | 21 |
| Perl | 17 |
| Biology | 16 |
| Brain | 15 |
| Calendar | 15 |
| Food | 15 |


Comments disabled
Thu, 22 Mar 2007
Symmetric functions
I used to teach math at the John Hopkins CTY program, which is a
well-regarded summer math camp. Kids would show up and finish a year
(or more) of high-school math in three weeks. We'd certify them by
giving them standardized tests, which might carry some weight with
their school. But before they were allowed to take the standardized
test, they had to pass a much more difficult and comprehensive exam
that we'd made up ourselves.
The most difficult question on the Algebra III exam presented the examinee with some intractable third degree polynomial—say x3 + 4x2 - 2x + 6—and asked for the sum of the cubes of its roots.
You might like to match your wits against the Algebra III students before reading the solution below.
In the three summers I taught, only about two students were able to solve this problem, which is rather tricky. Usually they would start by trying to find the roots. This is doomed, because the Algebra III course only covers how to find the roots when they are rational, and the roots here are totally bizarre.
Even clever students didn't solve the problem, which required several inspired tactics. First you must decide to let the roots be p, q, and r, and, using Descartes' theorem, say that
x3 + bx2 + cx + d = (x - p)(x - q)(x - r)
This isn't a hard thing to do, and a lot of the kids probably did try it, but it's not immediately clear what the point is, or that it will get you anywhere useful, so I think a lot of them never took it any farther.But expanding the right-hand side of the equation above yields:
x3 + bx2 + cx + d = x3 - (p + q + r)x2 + (pq + pr + qr)x - pqr
And so, equating coefficients, you have:| b | = | -(p + q + r) |
| c | = | pq + pr + qr |
| d | = | -pqr |
| -b3 | = | p3 + q3 + r3 + 3p2q + 3p2r + 3q2r + 3pq2 + 3pr2 + 3qr2 + 6pqr |
| p3 + q3 + r3 | = | -b3 + 3bc - 3d |
Or, to take an example that we can actually check, consider x3 - 6x2 + 11x - 6, whose roots are 1, 2, and 3. The sum of the cubes is 1 + 8 + 27 = 36, and indeed -b3 + 3bc - 3d = 63 + 3·(-6)·11 + 18 = 216 - 198 + 18 = 36.
This was a lot of algebra III, but once you have seen this example, it's not hard to solve a lot of similar problems. For instance, what is the sum of the squares of the roots of x2 + bx + c? Well, proceeding as before, we let the roots be p and q, so x2 + bx + c = (x - p)(x - q) = x2 - (p + q)x + pq, so that b = -(p + q) and c = pq. Then b2 = p2 + 2pq+ q2, and b2 - 2c = p2 + q2.
In general, if F is any symmetric function of the roots of a polynomial, then F can be calculated from the coefficients of the polynomial without too much difficulty.
Anyway, I was tinkering around with this at breakfast a couple of days ago, and I got to thinking about b2 - 2c = p2 + q2. If roots p and q are both integers, then b2 - 2c is the sum of two squares. (The sum-of-two-squares theorem is one of my favorites.) And the roots are integers only when the discriminant of the original polynomial is itself a square. But the discriminant in this case is b2 - 4c. So we have the somewhat odd-seeming statement that when b2 - 4c is a square, then b2 - 2c is a sum of two squares.
I found this surprising because it seemed so underconstrained: it says that you can add some random even number to a fairly large class of squares and the result must be a sum of two squares, even if the even number you added wasn't a square itself. But after I tried a few examples to convince myself I hadn't made a mistake, I was sure there had to be a very simple, direct way to get to the same place.
It took some fiddling, but eventually I did find it. Say that b2 - 4c = a2. Then b and a must have the same parity, so p = (b + a)/2 is an integer, and we can write b = p + q and a = p - q where p and q are both integers.
Then c = (b2 - a2)/4 is just pq, and b2 - 2c = p2 + q2.
So that's where that comes from.
It seems like there ought to be an interesting relationship between the symmetric functions of roots of a polynomial and their expression in terms of the coefficients of the polynomial. The symmetric functions of degree N are all linear combinations of a finite set of symmetric functions. For example, any second-degree symmetric function of two variables has the form a(p2 + q2) + 2bpq. We can denote these basic symmetric functions of two variables as Fi,j(p, q) = Σpiqj. Then we have identities like (F1,0)2 = F2,0 + F1,1 and (F1,0)3 = F3,0 + 3F2,1.
Maybe I'll do an article about this in a week or two.
[Other articles in category /math] permanent link
Tue, 20 Mar 2007
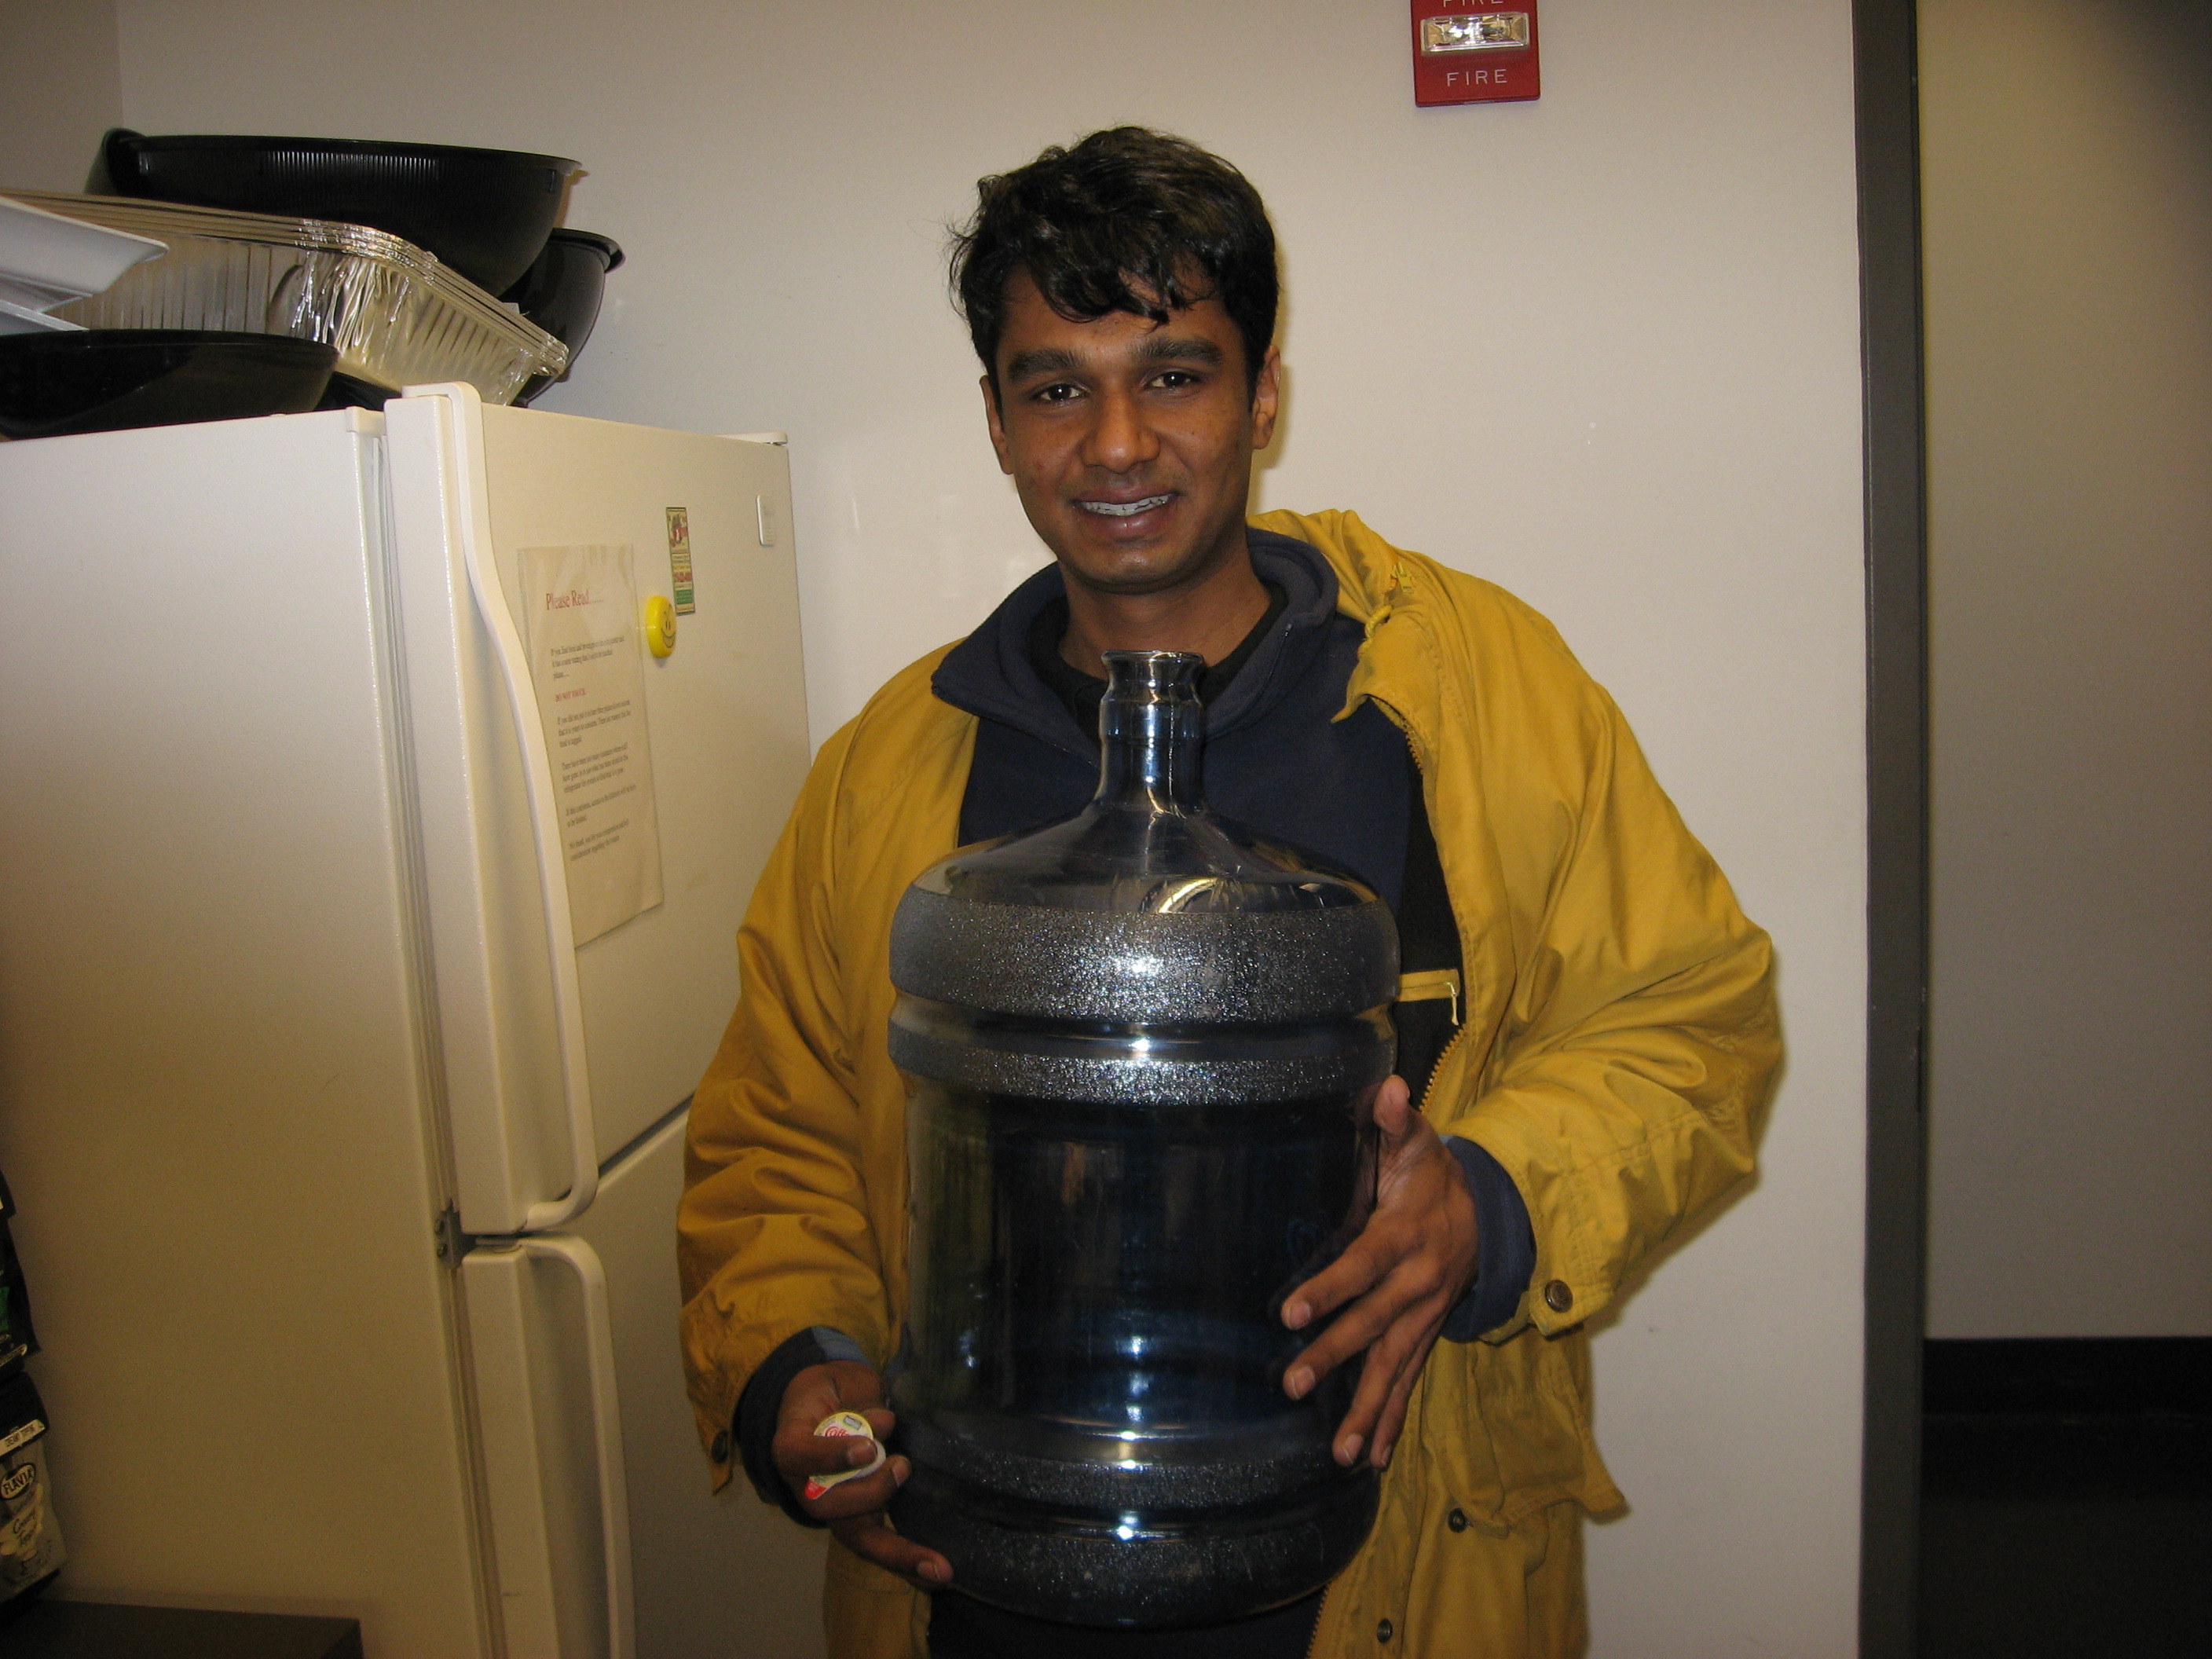
How big is a five-gallon jug?
Office water coolers in the United States commonly take five-gallon
jugs of water. You are probably familiar with these jugs, but here is
a picture of a jug, to refresh your memory. A random graduate student
has been provided for scale:
Once you've settled on your estimate, compare it with the correct answer, below.
Answer:
| It is about 2/3 of a cubic foot. One gallon contains about 231 cubic inches. Five gallons contain about 1155 cubic inches. One cubic foot contains 12×12×12 = 1728 cubic inches. |
Hard to believe, isn't it? ("Strange but true.") I took one of these jugs around my office last year, asking everyone to guess how big it was; nobody came close. People typically guessed that it was about three times as big as it actually is.
This puzzle totally does not work anywhere except in the United States. The corresponding puzzle for the rest of the world is "Here is a twenty-liter jug. Can you guess the volume of the jug in liters?" I suppose this is an argument in favor of the metric system.
[Other articles in category /tech] permanent link
Mon, 19 Mar 2007
Your age as a fraction
Little kids often report their ages as "two and a half" or sometimes
even "three and three quarters". These evaluations are usually based
on whole months: if you were born on April 2, 1969, then on October
2, 1971 you start reporting your age as "two and a half", and, if you
choose to report your age as "three and three quarters", you
conventionally may begin on January 2, 1973.
However, these reports are not quite accurate. On January 2, 1973, exactly 3 years and 9 months from your birthday, you would be 1,371 days old, or 3 years plus 275 days. 275/365 = 0.7534. On January 1, you were only 3 + 274/365 days old, which is 3.7507 years, and so January 1 is the day on which you should have been allowed to start reporting your age as "three and three quarters". This slippage between days and months occurs in the other direction as well, so there may be kids wandering around declaring themselves as "three and a half" a full day before they actually reach that age.
Clearly this is one of the major problems facing our society, so I wanted to make up a table showing, for each number of days d from 1 to 365, what is the simplest fraction a/b such that when it is d days after your birthday, you are (some whole number and) a/b years. That is, I wanted a/b such that d/365 ≤ a/b < (d+1)/365.
Then, by consulting the table each day, anyone could find out what new fraction they might have qualified for, and, if they preferred the new fraction to the old, they might start reporting their age with that fraction.
There is a well-developed branch of mathematics that deals with this problem. To find simple fractions that approximate any given rational number, or lie in any range, we first expand the bounds of the range in continued fraction form. For example, suppose it has been 208 days since your birthday. Then today your age will range from y plus 208/365 years up to y plus 209/365 years.
Then we expand 208/365 and 209/365 as continued fractions:
208/365 = [0; 1, 1, 3, 12, 1, 3]Where [0; 1, 1, 3, 12, 1, 3] is an abbreviation for the typographically horrendous expression:
209/365 = [0; 1, 1, 2, 1, 16, 1, 2]
$$ 0 + {1\over \displaystyle 1 + {\strut 1\over\displaystyle 1 + {\strut 1\over\displaystyle 3 + {\strut 1\over\displaystyle 12 + {\strut 1\over\displaystyle 1 + {\strut 1\over\displaystyle 3 }}}}}}$$
And similarly the other one. (Oh, the suffering!)Then you need to find a continued fraction that lies numerically in between these two but is as short as possible. (Shortness of continued fractions corresponds directly to simplicity of the rational numbers they represent.) To do this, take the common initial segment, which is [0; 1, 1], and then apply an appropriate rule for the next place, which depends on whether the numbers in the next place differ by 1 or by more than 1, whether the first difference occurs in an even position or an odd one, mumble mumble mumble; in this case the rules say we should append 3. The result is [0; 1, 1, 3], or, in conventional notation:
$$ 0 + {1\over \displaystyle 1 + {\strut 1\over\displaystyle 1 + {\strut 1\over\displaystyle 3 }}} $$
which is equal to 4/7. And indeed, 4/7 of a year is 208.57 days, so sometime on the 208th day of the year, you can start reporting your age as (y and) 4/7 years.Since I already had a library for calculating with continued fractions, I started extending it with functions to handle this problem, to apply all the fussy little rules for truncating the continued fraction in the right place, and so on.
Then I came to my senses, and realized there was a better way, at least for the cases I wanted to calculate. Given d, we want to find the simplest fraction a/b such that d/365 ≤ a/b < (d+1)/365. Equivalently, we want the smallest integer b such that there is some integer a with db/365 ≤ a < (d+1)b/365. But b must be in the range (2 .. 365), so we can easily calculate this just by trying every possible value of b, from 2 on up:
        use POSIX 'ceil', 'floor';

        sub approx_frac {
          my ($n, $d) = @_;
          for my $b (1 .. $d) {
            my ($lb, $ub) = ($n*$b/$d, ($n+1)*$b/$d);
            if (ceil($lb) < ceil($ub) && ceil($ub) > $ub) {
              return (int($ub), $b);
            }
          }
          return ($n, $d);
        }
The fussing with ceil() in the main test is to make the
ranges open on the upper end: 2/5 is not in the range
[3/10, 4/10), but it is in the range
[4/10, 5/10). Then we can embed this in a simple report-printing
program:
        my $N = shift || 365;

        for my $i (1..($N-1)) {
          my ($a, $b) = approx_frac($i, $N);
          print "$i/$N: $a/$b\n";
        }
For tenths, the simplest fractions are:
| 1/10 ≤ | 1/6 | < 2/10 | (0.1667) |
| 2/10 ≤ | 1/4 | < 3/10 | (0.2500) |
| 3/10 ≤ | 1/3 | < 4/10 | (0.3333) |
| 4/10 ≤ | 2/5 | < 5/10 | (0.4000) |
| 5/10 ≤ | 1/2 | < 6/10 | (0.5000) |
| 6/10 ≤ | 2/3 | < 7/10 | (0.6667) |
| 7/10 ≤ | 3/4 | < 8/10 | (0.7500) |
| 8/10 ≤ | 4/5 | < 9/10 | (0.8000) |
| 9/10 ≤ | 9/10 | < 10/10 | (0.9000) |
This works fine, and it is a heck of a lot simpler than all the continued fraction stuff. The more so because the continued fraction library is written in C.
For the application at hand, an alternative algorithm is to go through all fractions, starting with the simplest, placing each one into the appropriate d/365 slot, unless that slot is already filled by a simpler fraction:
        my $N = shift || 365;
        my $unfilled = $N;

        DEN:
        for my $d (2 .. $N) {
          for my $n (1 .. $d-1) {
            my $a = int($n * $N / $d);
            unless (defined $simple[$a]) {
              $simple[$a] = [$n, $d];
              last DEN if --$unfilled == 0;
            }
          }
        }

        for (1 .. $N-1) {
          print "$_/$N: $simple[$_][0]/$simple[$_][1]\n";
        }
A while back I wrote an article about using the sawed-off
shotgun approach instead of the subtle technique approach. This
is another case where the simple algorithm wins big. It is an
n2 algorithm, whereas I think the continued fraction
one is n log n in the worst case. But unless you're
preparing enormous tables, it really doesn't matter much. And the
proportionality constant on the O() is surely a lot smaller for
the simple algorithms.(It might also be that you could optimize the algorithms to go faster: you can skip the body of the loop in the slot-filling algorithm whenever $n and $d have a common factor, which means you are executing the body only n log n times. But testing for common factors takes time too...)
I was going to paste in a bunch of tabulations, but once again I remembered that it makes more sense to just let you run the program for yourself. Here is a form that will generate the table for all the fractions 1/N .. (N-1)/N; use N=365 to generate a table of year fractions for common years, and N=366 to generate the table for leap years:
[ Addendum 20070429: There is a followup to this article. ]
[Other articles in category /math] permanent link
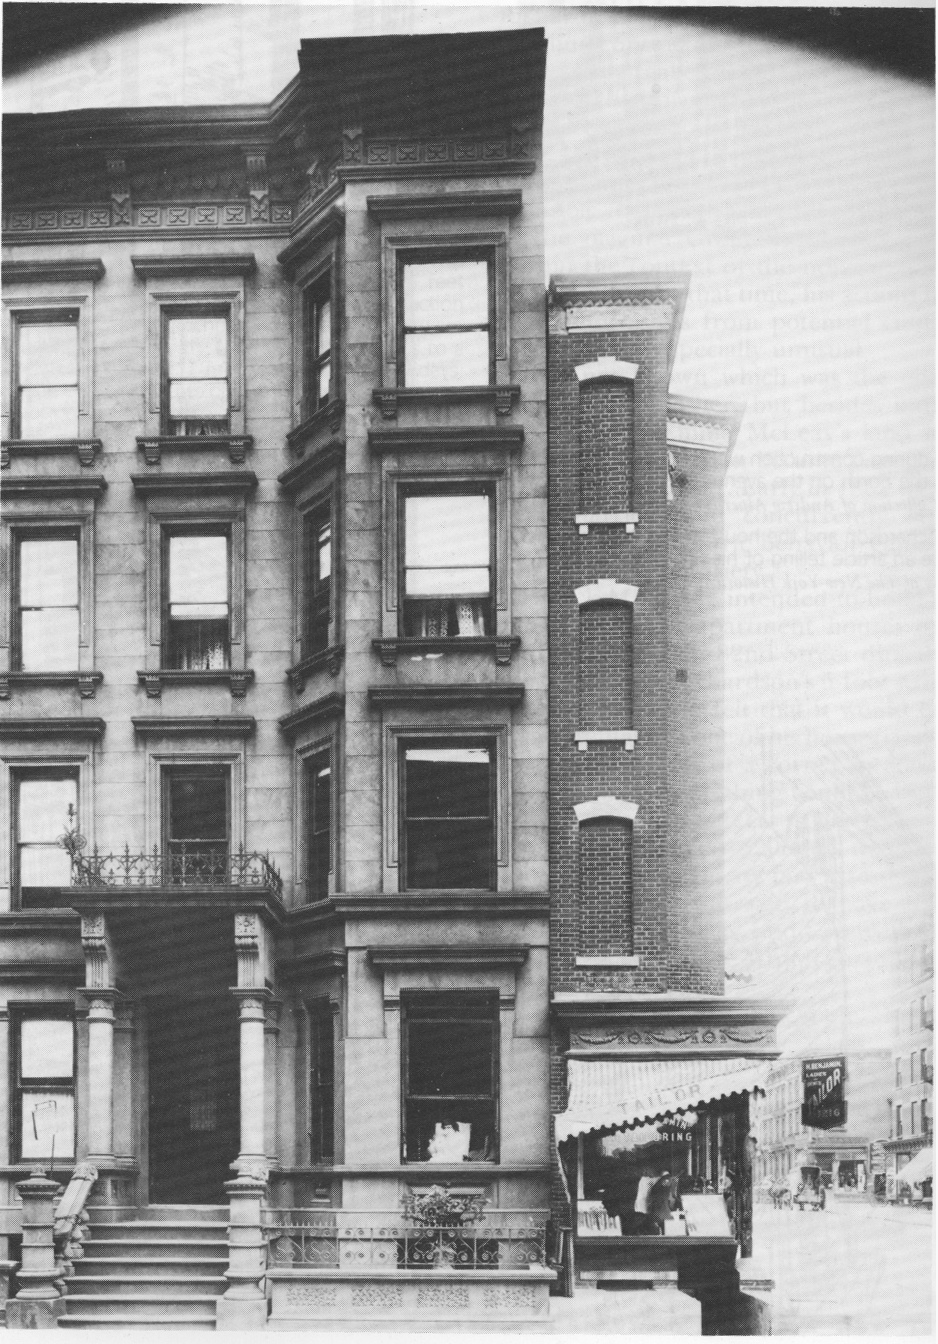
Wed, 14 Mar 2007 The subject of really narrow buildings came up on Reddit last week, and my post about the "Spite House" was well-received. Since pictures of it seem to be hard to come by, I scanned the pictures from New York's Architectural Holdouts by Andrew Alpern and Seymour Durst.The book is worth checking out, particularly if you are familiar with New York. The canonical architectural holdout occurs when a developer is trying to assemble a large parcel of land for a big building, and a little old lady refuses to sell her home. The book is full of astonishing pictures: skyscrapers built with holdout buildings embedded inside them and with holdout buildings wedged underneath them. Skyscrapers built in the shape of the letter E (with the holdouts between the prongs), the letter C (with the holdout in the cup), and the letter Y (with the holdout in the fork).
 |
| Photo credit: Jerry Callen |
 But
anyway, the Spite House. The story, as told by Alpern and Durst, is
that around 1882, Patrick McQuade wanted to build some houses on 82nd
Street at Lexington Avenue. The adjoining parcel of land, around the
corner on Lexington, was owned by Joseph Richardson, shown at left.
If McQuade could acquire this parcel, he would be able to extend his
building all the way to Lexington Avenue, and put windows on that side
of the building. No problem: the parcel was a strip of land 102 feet
long and five feet wide along Lexington, useless for any other
purpose. Surely Richardson would sell.
But
anyway, the Spite House. The story, as told by Alpern and Durst, is
that around 1882, Patrick McQuade wanted to build some houses on 82nd
Street at Lexington Avenue. The adjoining parcel of land, around the
corner on Lexington, was owned by Joseph Richardson, shown at left.
If McQuade could acquire this parcel, he would be able to extend his
building all the way to Lexington Avenue, and put windows on that side
of the building. No problem: the parcel was a strip of land 102 feet
long and five feet wide along Lexington, useless for any other
purpose. Surely Richardson would sell.
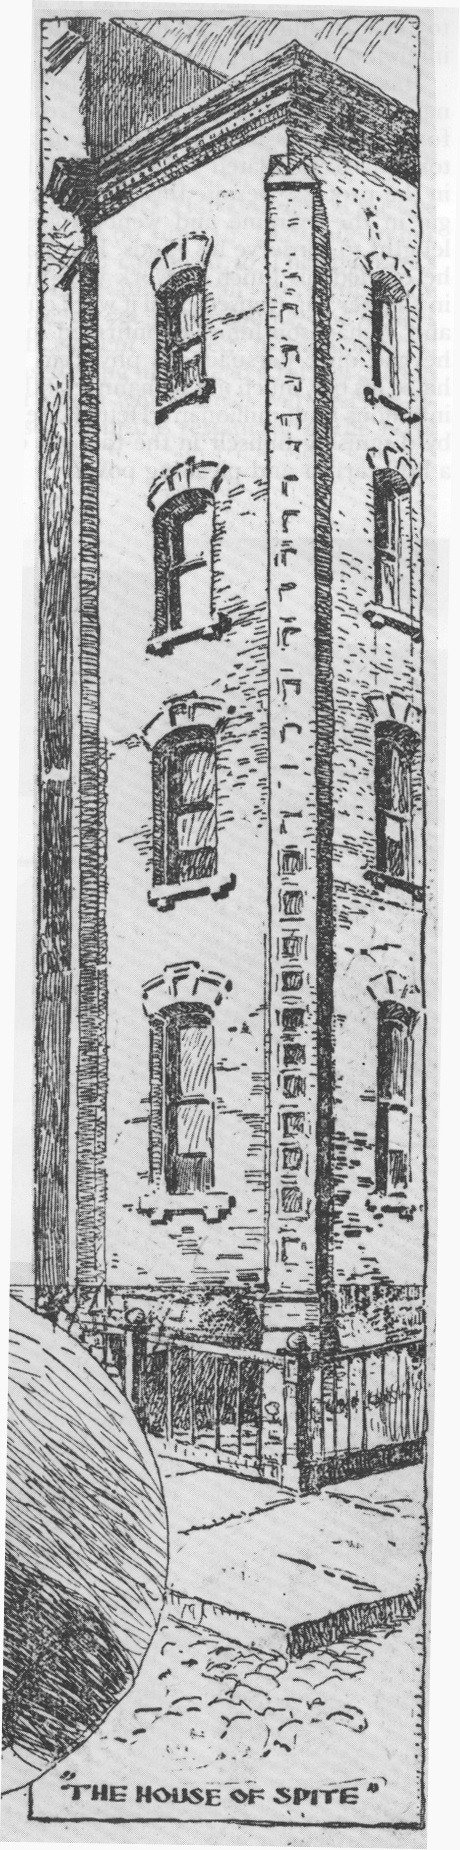
McQuade offered $1,000, but Richardson demanded $5,000. Unwilling to pay, McQuade started building his houses anyway, complete with windows looking out on Richardson's five-foot-wide strip, which was unbuildable. Or so he thought.
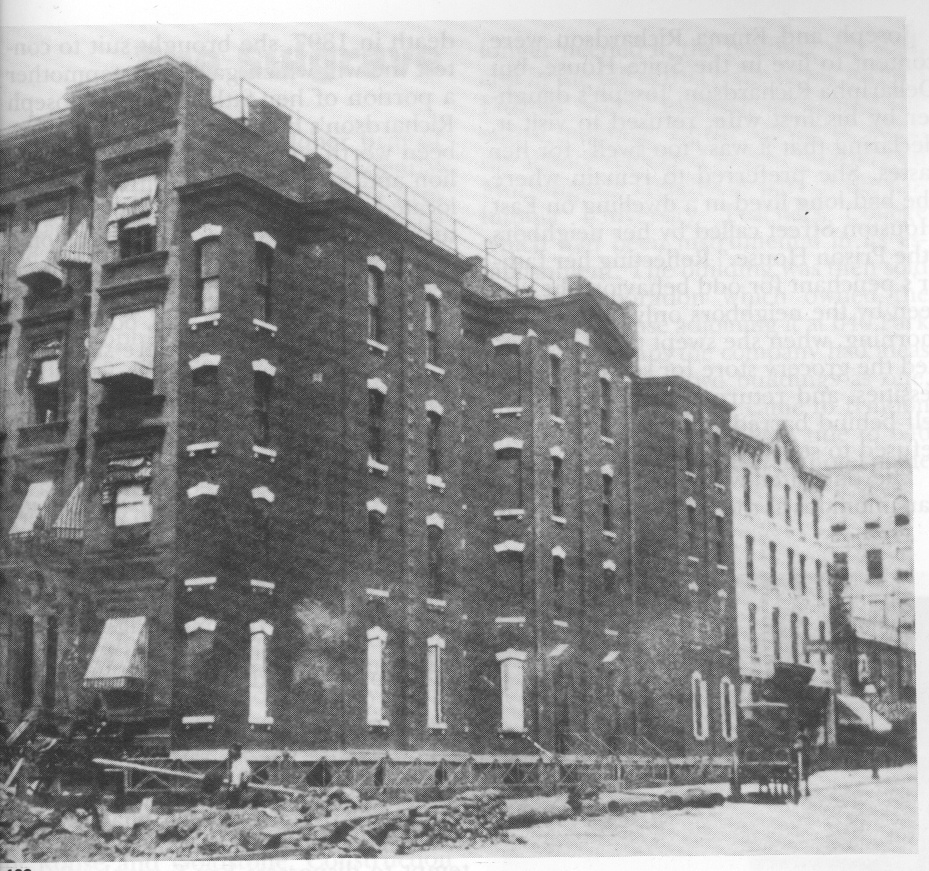
Richardson built a building five
feet wide and 102 feet long, blocking McQuade's Lexington Avenue
windows. (Click the pictures for large versions.)
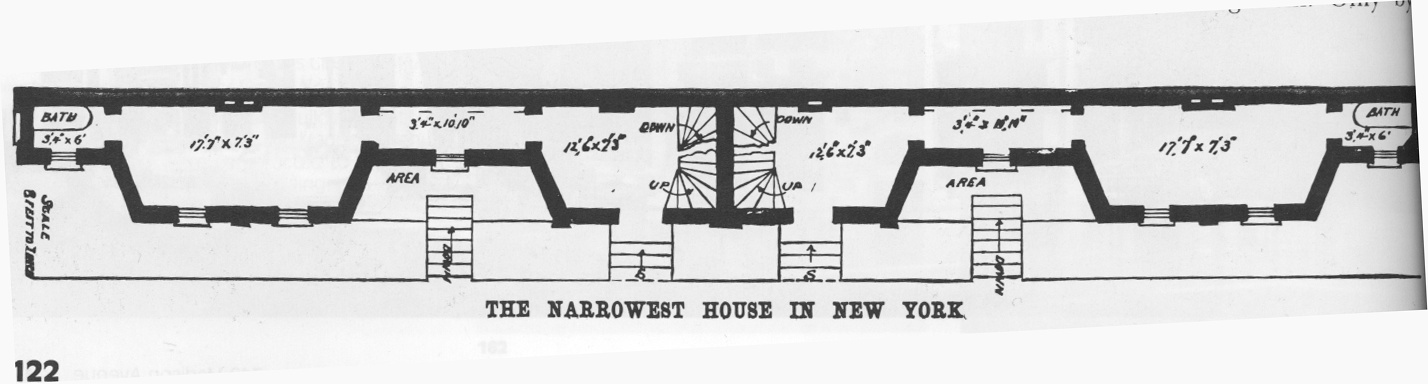
Richardson took advantage of a clause in the building codes that allowed him to build bay window extensions in his building. This allowed him to extend its maximum width 2'3" beyond the boundary of the lot. (Alpern and Durst say "In those days, such encroachments on the public sidewalks were not prohibited.") The rooms of the Spite House were in these bay window extensions, connected by extremely narrow hallways:
 After construction was completed, Richardson moved into the Spite
House and lived there until he died in 1897. The pictures below and
at left are from that time.
After construction was completed, Richardson moved into the Spite
House and lived there until he died in 1897. The pictures below and
at left are from that time.


Picture credits
The photograph of the Macy's Herald Square store is copyright ©2004 Jerry Callen, and is used with permission.All other pictures and photographs are in the public domain. I took them from pages 122–124 of the book New York's Architectural Holdouts, by Alpern and Durst. The original sources, as given by Alpern and Durst, are as follows:
|
| Collection of Andrew Alpern. |
|
| January 1897 issue of Scientific American.
|
|
| New York Journal, 5 June 1897 |
|
| New York Public Service Commission |
[Other articles in category /tech] permanent link
Fri, 09 Mar 2007
Bernoulli processes
A family has four children. Assume that the sexes of the four
children are independent, and that boys and girls are equiprobable.
What's the most likely distribution of boys and girls?
Well,it depends how you count. Are there three possibilities or five?
|
|
| Boys | Girls | Probability |
|---|---|---|
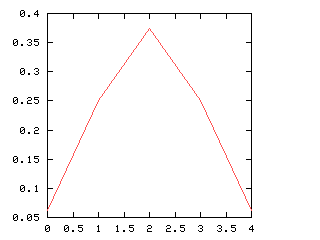
| 0 | 4 | 0.0625 |
| 1 | 3 | 0.25 |
| 2 | 2 | 0.375 |
| 3 | 1 | 0.25 |
| 4 | 0 | 0.0625 |
This distribution is depicted in the graph at right. Individually, (3, 1) and (1, 3) are less likely than (2, 2). But "three-and-one" includes both (1, 3) and (3, 1), whereas "two-and-two" includes only (2, 2). So if you group outcomes into three categories, as in the green division above left, "three-and-one" comes out more frequent overall than "two-and-two":
| One sex | The other | Total probability |
|---|---|---|
| 4 | 0 | 0.125 |
| 3 | 1 | 0.5 |
| 2 | 2 | 0.375 |
It makes a difference whether you specify the sexes in the
distribution. If a "distribution" is a thing like "b of the
children are boys and g are girls", then the most frequent
distribution is (2, 2). But if a distribution is "x of one sex
and y of the other", then the most frequent distribution [3, 1],
where I've used square brackets to show that the order is not
important. [3, 1] is the same as [1, 3].
This is true in general. Suppose someone has 1,000 kids. What's the most likely distribution of sexes? It's 500 boys and 500 girls, which I've been writing (500, 500). This is more likely than either (499, 501) or (501, 499). But if you consider "Equal numbers" versus "501-to-499", which I've been writing as [500, 500] and [501, 499], then [501, 499] wins:
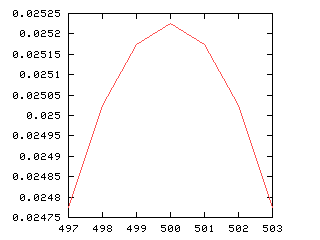
| Boys | Girls | Probability |
|---|---|---|
| 501 | 499 | 0.02517 |
| 500 | 500 | 0.02522 |
| 499 | 501 | 0.02517 |
| One sex | The other | Total probability |
|---|---|---|
| 501 | 499 | 0.05035 |
| 500 | 500 | 0.02522 |
|
Why is this? [4, 3, 3, 3] covers the four most frequent distributions: (4, 3, 3, 3), (3, 4, 3, 3), (3, 3, 4, 3), and (3, 3, 3, 4). But [4, 4, 3, 2] covers twelve quite frequent distributions: (4, 4, 3, 2), (4, 3, 2, 4), and so on. Even though the individual distributions aren't as common as (4, 4, 4, 3), there are twelve of them instead of 4. This gives [4, 4, 3, 2] the edge.
[5, 4, 3, 1] includes 24 distributions, and ends up tied for second place. A complete table is in the sidebar at left.
(For 5-card poker hands, the situation is much simpler. [2, 2, 1, 0] is most common, followed by [2, 1, 1, 1] and [3, 1, 1, 0] (tied), then [3, 2, 0, 0], [4, 1, 0, 0], and [5, 0, 0, 0].)
This same issue arose in my
recent article on Yahtzee roll probabilities. There we had six
"suits", which represented the six possible rolls of a die, and I
asked how frequent each distribution of "suits" was when five dice
were rolled. For distribution [p1,
p2, ...], we let ni be the
number of p's that are equal to i. Then the expression
for probability of the distribution has a factor of  in the denominator, with the result that
distributions with a lot of equal-sized parts tend to appear less
frequently than you might otherwise expect.
in the denominator, with the result that
distributions with a lot of equal-sized parts tend to appear less
frequently than you might otherwise expect.
I'm not sure how I got so deep into this end of the subject, since I didn't really want to compare complex distributions to each other so much as to compare simple distributions under different conditions. I had originally planned to discuss the World Series, which is a best-four-of-seven series of baseball games that we play here in the U.S. and sometimes in that other country to the north. Sometimes one team wins four games in a row ("sweeps"); other times the Series runs the full seven games.
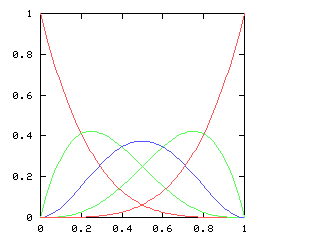
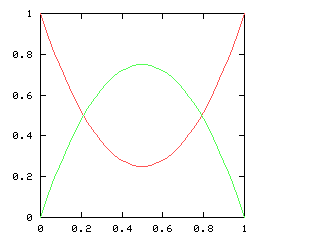
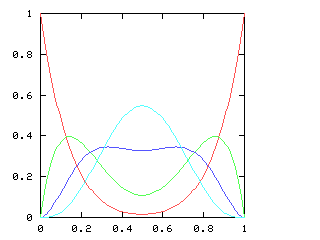
You might expect that even splits would tend to occur when the two teams playing were evenly matched, but that when one team was much better than the other, the outcome would be more likely to be a sweep. Indeed, this is generally so. The chart below graphs the possible outcomes. The x-axis represents the probability of the Philadelphia Phillies winning any individual game. The y-axis is the probability that the Phillies win the entire series (red line), which in turn is the sum of four possible events: the Phillies win in 4 games (green), in 5 games (dark blue), in 6 games (light blue), or in 7 games (magenta). The probabilities of the Nameless Opponents winning are not shown, because they are exactly the opposite. (That is, you just flip the whole chart horizontally.)
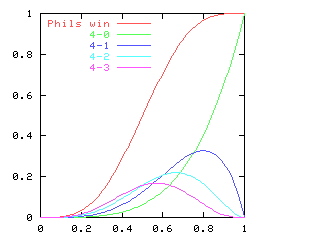
Clearly, the Phillies have a greater-than-even chance of winning the Series if and only if they have a greater-than-even chance of winning each game. If they are playing a better team, they are likely to lose, but if they do win they are most likely to do so in 6 or 7 games. A sweep is the most likely outcome only if the Opponents are seriously overmatched, and have a less than 25% chance of winning each game. (The lines for the 4-a outcome and the 4-b outcome cross at 1-(pa / pb)1/(b-a), where pi is 1, 4, 10, 20 for i = 0, 1, 2, 3.)
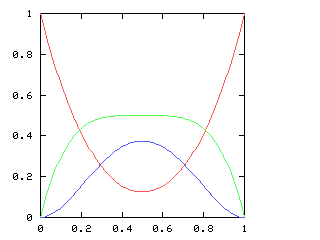
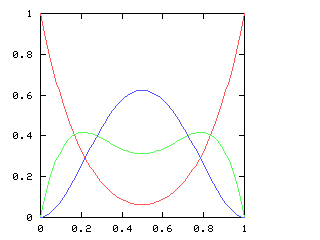
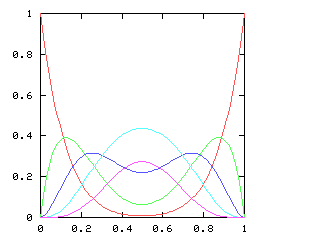
If we consider just the first four games of the World Series, there are five possible outcomes, ranging from a Phillies sweep, through a two-and-two split, to an Opponents sweep. Let p be the probability of the Phillies winning any single game. As p increases, so does the likelihood of a Phillies sweep. The chart below plots the likelihood of each of the five possible outcomes, for various values of p, charted here on the horizontal axis:
When is the 2-2 split the most likely outcome? Only when the Phillies and the Opponents are approximately evenly matched, with neither team no more than 60% likely to win any game.
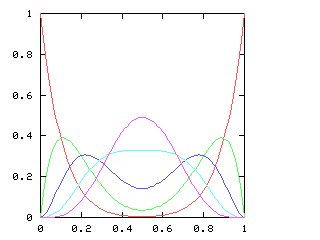
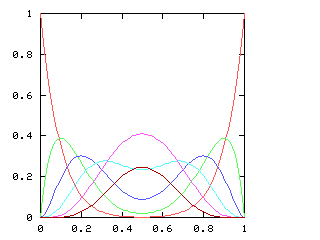
But just as with the sexes of the four kids, we get a different result if we consider the outcomes that don't distinguish the teams. For the first four games of the World Series, there are only three outcomes: a sweep (which we've been writing [4, 0]), a [3, 1] split, and a [2, 2] split:
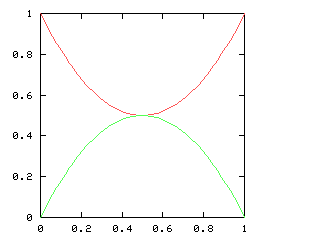
Here are the corresponding charts for series of various lengths.
| Series length (games) | Distinguish teams | Don't distinguish teams |
|---|---|---|
| 2 | 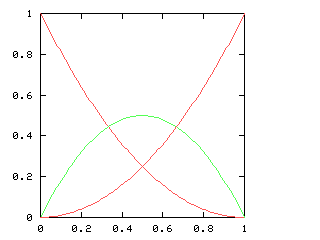
| 
|
| 3 | 
| 
|
| 4 |
|
|
| 5 | 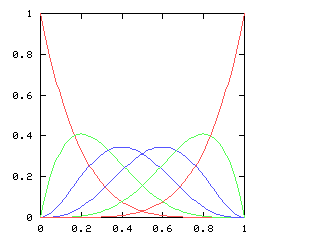
| 
|
| 6 | 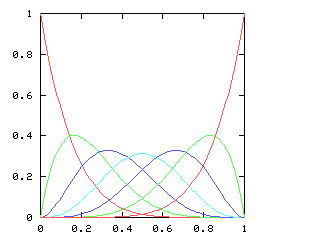
| 
|
| 7 | 
| 
|
| 8 | 
| 
|
| 9 | 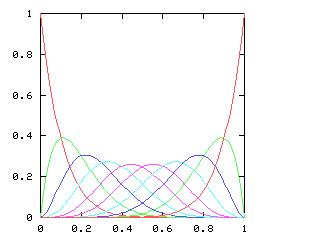
| 
|
| 10 | 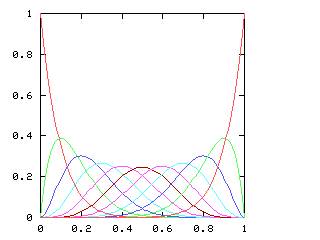
| 
|
I have no particular conclusion to announce about this; I just thought that the charts looked cool.
Coming later, maybe: reasoning backwards: if the Phillies sweep the World Series, what can we conclude about the likelihood that they are a much better team than the Opponents? (My suspicion is that you can conclude a lot more by looking at the runs scored and runs allowed totals.)
(Incidentally, baseball players get a share of the ticket money for World Series games, but only for the first four games. Otherwise, they could have an an incentive to prolong the series by playing less well than they could, which is counter to the ideals of sport. I find this sort of rule, which is designed to prevent conflicts of interest, deeply satisfying.)
[Other articles in category /math] permanent link
Mon, 05 Mar 2007
An integer partition puzzle
Last month I wrote an article
about calculating Yahtzee probabilities and another one about counting
permutations in which integer partitions came up. An integer
partition of some integer N is an unordered sequence of
positive integers that sums to N. For example, there are 5
different integer partitions of 4:
| 1 1 1 1 |
| 2 1 1 |
| 2 2 |
| 3 1 |
| 4 |
Here's one interesting fact: it's quite easy to calculate the number of partitions of N. Let P(n, k) be the number of partitions of n into parts that are at least k. Then it's easy to see that:
$$P(n, k) = \sum_{i=k}^{n-1} P(n-i, k)$$
And there are simple boundary conditions: P(n, n) = 1; P(n, k) = 0 when k > n, and so forth. And P(n), the number of partitions of n into parts of any size, is just P(n, 1). So a program to calculate P(n) is very simple:
        my @P;
        sub P {
          my ($n, $k) = @_;
          return 0 if $n < 0;
          return 1 if $n == 0;
          return 0 if $k > $n;
          my $r = $P[$n] ||= [];
          return $r->[$k] if defined $r->[$k];
          return $r->[$k] = P($n-$k, $k) + P($n, $k+1);
        }

        sub part {
          P($_[0], 1);
        }

        for (1..100) {
          printf "%3d %10d\n", $_, part($_);
        }
I had a funny conversation once with someone who ought to have known
better: I remarked that it was easy to calculate P(n),
and disagreed with me, asking why Rademacher's
closed-form expression for P(n) had been such a
breakthrough. But the two properties are independent; the same is
true for lots of stuff. Just because you can calculate something
doesn't mean you understand it. Calculating ζ(2) is quick and
easy, but it was a major breakthrough when Euler discovered that it
was equal to π2/6. Calculating ζ(3) is even
quicker and easier, but nobody has any idea what the value
represents.Similarly, P(n) is easy to calculate, but harder to understand. Ramanujan observed, and proved, that P(5k+4) is always a multiple of 5, which had somehow escaped everyone's notice until then. And there are a couple of other similar identities which were proved later: P(7k+5) is always a multiple of 7; P(11k+6) is always a multiple of 11. Based on that information, any idiot could conjecture that P(13k+7) would always be a multiple of 13; this conjecture is wrong. (P(7) = 15.)
Anyway, all that is just leading up to the real point of this note, which is that I was tabulating the number of partitions of n into exactly k parts, which is also quite easy. Let's call this Q(n, k). And I discovered that Q(13, 4) = Q(13, 5). There are 18 ways to divide a pile of 13 beans into 4 piles, and also 18 ways to divide the beans into 5 piles.
|
|
So far, I haven't turned anything up; it seems to be a coincidence. A simpler problem of the same type is that Q(8, 3) = Q(8, 4); that seems to be a coincidence too:
|
|
Oh well, sometimes these things don't work out the way you'd like.
[Other articles in category /math] permanent link
"Go ahead, throw your vote away!"
I noticed this back in November right afer the election, when I was
reading the election returns in the newspaper. There were four
candidates for the office of U.S. Senator in Nevada. One of these was
Brendan Trainor, running for the Libertarian party.
Trainor received a total of 5,269 votes, or 0.90% of votes cast.
A fifth choice, "None of these candidates", was available. This choice received 8,232 votes, or 1.41%.
Another candidate, David Schumann, representing the Independent American Party, was also defeated by "None of these candidates".
I'm not sure what conclusion to draw from this. I am normally sympathetic to the attempts of independent candidates and small parties to run for office, and I frequently vote for them. But when your candidate fails to beat out "None of the above", all I can think is that you must be doing something terribly wrong.
[ Addendum 20200723: Wikipedia's article on Nevada's “None of These Candidates” option ]
[Other articles in category /politics] permanent link