Mark Dominus (陶敏修)
mjd@pobox.com

Archive:
| 2026: | J |
| 2025: | JFMAMJ |
| JASOND | |
| 2024: | JFMAMJ |
| JASOND | |
| 2023: | JFMAMJ |
| JASOND | |
| 2022: | JFMAMJ |
| JASOND | |
| 2021: | JFMAMJ |
| JASOND | |
| 2020: | JFMAMJ |
| JASOND | |
| 2019: | JFMAMJ |
| JASOND | |
| 2018: | JFMAMJ |
| JASOND | |
| 2017: | JFMAMJ |
| JASOND | |
| 2016: | JFMAMJ |
| JASOND | |
| 2015: | JFMAMJ |
| JASOND | |
| 2014: | JFMAMJ |
| JASOND | |
| 2013: | JFMAMJ |
| JASOND | |
| 2012: | JFMAMJ |
| JASOND | |
| 2011: | JFMAMJ |
| JASOND | |
| 2010: | JFMAMJ |
| JASOND | |
| 2009: | JFMAMJ |
| JASOND | |
| 2008: | JFMAMJ |
| JASOND | |
| 2007: | JFMAMJ |
| JASOND | |
| 2006: | JFMAMJ |
| JASOND | |
| 2005: | OND |
Subtopics:
| Mathematics | 245 |
| Programming | 100 |
| Language | 95 |
| Miscellaneous | 75 |
| Book | 50 |
| Tech | 49 |
| Etymology | 35 |
| Haskell | 33 |
| Oops | 30 |
| Unix | 27 |
| Cosmic Call | 25 |
| Math SE | 25 |
| Law | 22 |
| Physics | 21 |
| Perl | 17 |
| Biology | 16 |
| Brain | 15 |
| Calendar | 15 |
| Food | 15 |
Comments disabled
Mon, 24 Sep 2018
A long time ago, I wrote up a blog article about how to derive the linear regression formulas from first principles. Then I decided it was not of general interest, so I didn't publish it. (Sometime later I posted it to math stack exchange, so the effort wasn't wasted.)
The basic idea is, you have some points !!(x_i, y_i)!!, and you assume that they can be approximated by a line !!y=mx+b!!. You let the error be a function of !!m!! and !!b!!: $$\varepsilon(m, b) = \sum (mx_i + b - y_i)^2$$ and you use basic calculus to find !!m!! and !!b!! for which !!\varepsilon!! is minimal. Bing bang boom.
I knew this for a long time but it didn't occur to me until a few months ago that you could use basically the same technique to fit any other sort of curve. For example, suppose you think your data is not a line but a parabola of the type !!y=ax^2+bx+c!!. Then let the error be a function of !!a, b, !! and !!c!!:
$$\varepsilon(a,b,c) = \sum (ax_i^2 + bx_i + c - y_i)^2$$
and again minimize !!\varepsilon!!. You can even get a closed form as you can with ordinary linear regression.
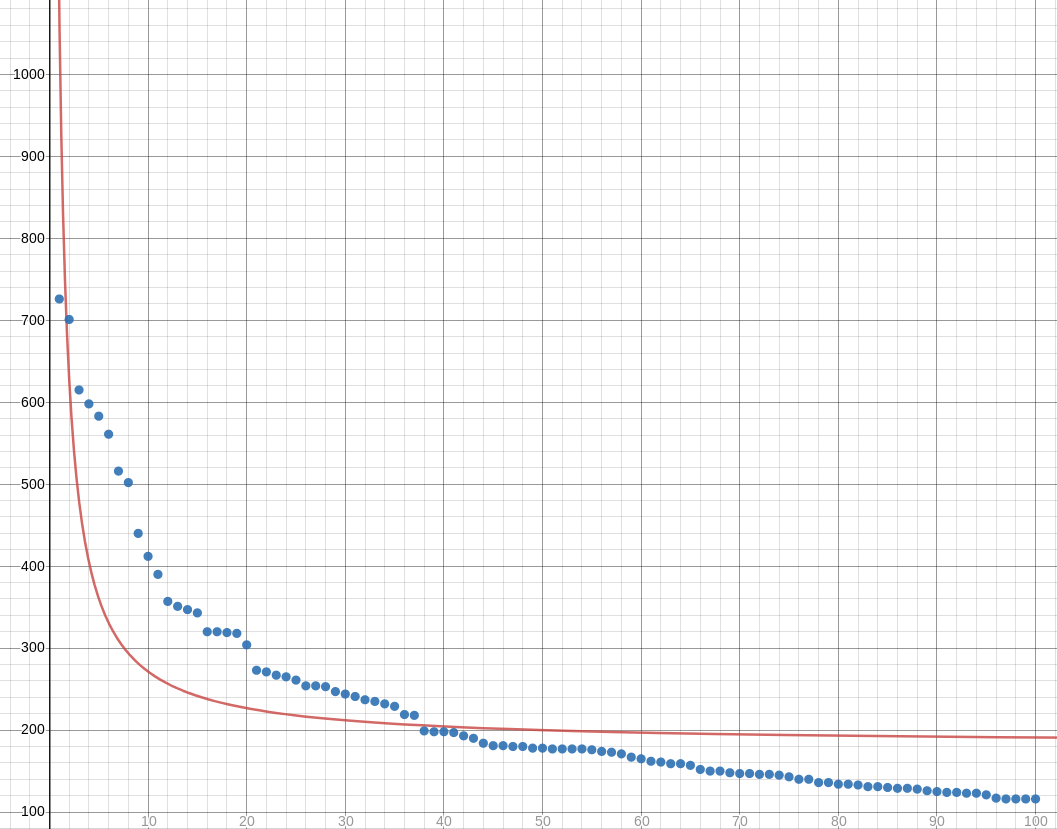
I especially wanted to try fitting hyperbolas to data that I expected to have a Zipfian distribution. For example, take the hundred most popular names for girl babies in Illinois in 2017. Is there a simple formula which, given an ordinal number like 27, tells us approximately how many girls were given the 27th most popular name that year? (“Scarlett”? Seriously?)
I first tried fitting a hyperbola of the form !!y = c + \frac ax!!. We could, of course, take !!y_i' = \frac 1{y_i}!! and then try to fit a line to the points !!\langle x_i, y_i'\rangle!! instead. But this will distort the measurement of the error. It will tolerate gross errors in the points with large !!y!!-coordinates, and it will be extremely intolerant of errors in points close to the !!x!!-axis. This may not be what we want, and it wasn't what I wanted. So I went ahead and figured out the Zipfian regression formulas:
$$ \begin{align} a & = \frac{HY-NQ}D \\ c & = \frac{HQ-JY}D \end{align} $$
Where:
$$\begin{align} H & = \sum x_i^{-1} \\ J & = \sum x_i^{-2} \\ N & = \sum 1\\ Q & = \sum y_ix_i^{-1} \\ Y & = \sum y_i \\ D & = H^2 - NJ \end{align} $$
When I tried to fit this to some known hyperbolic data, it worked just fine. For example, given the four points !!\langle1, 1\rangle, \langle2, 0.5\rangle, \langle3, 0.333\rangle, \langle4, 0.25\rangle!!, it produces the hyperbola $$y = \frac{1.00018461538462}{x} - 0.000179487179486797.$$ This is close enough to !!y=\frac1x!! to confirm that the formulas work; the slight error in the coefficients is because we used !!\bigl\langle3, \frac{333}{1000}\bigr\rangle!! rather than !!\bigl\langle3, \frac13\bigr\rangle!!.
Unfortunately these formulas don't work for the Illinois baby data. Or rather, the hyperbola fits very badly. The regression produces !!y = \frac{892.765272442475}{x} + 182.128894972025:!!

I think maybe I need to be using some hyperbola with more parameters, maybe something like !!y = \frac a{x-b} + c!!.
In the meantime, here's a trivial script for fitting !!y = \frac ax + c!! hyperbolas to your data:
while (<>) {
  chomp;
  my ($x, $y) = split;
  ($x, $y) = ($., $x) if not defined $y;
  $H += 1/$x;
  $J += 1/($x*$x);
  $N += 1;
  $Q += $y/$x;
  $Y += $y;
}

my $D = $H*$H - $J*$N;
my $c = ($Q*$H - $J*$Y)/$D;
my $a = ($Y*$H - $Q*$N)/$D;

print "y = $a / x + $c\n";
[ Addendum 20180925: Shreevatsa R. asked a related question on StackOverflow and summarized the answers. The problem is more complex than it might first appear. Check it out. ]
[Other articles in category /math] permanent link


