Mark Dominus (陶敏修)
mjd@pobox.com

Archive:
| 2026: | JFM |
| 2025: | JFMAMJ |
| JASOND | |
| 2024: | JFMAMJ |
| JASOND | |
| 2023: | JFMAMJ |
| JASOND | |
| 2022: | JFMAMJ |
| JASOND | |
| 2021: | JFMAMJ |
| JASOND | |
| 2020: | JFMAMJ |
| JASOND | |
| 2019: | JFMAMJ |
| JASOND | |
| 2018: | JFMAMJ |
| JASOND | |
| 2017: | JFMAMJ |
| JASOND | |
| 2016: | JFMAMJ |
| JASOND | |
| 2015: | JFMAMJ |
| JASOND | |
| 2014: | JFMAMJ |
| JASOND | |
| 2013: | JFMAMJ |
| JASOND | |
| 2012: | JFMAMJ |
| JASOND | |
| 2011: | JFMAMJ |
| JASOND | |
| 2010: | JFMAMJ |
| JASOND | |
| 2009: | JFMAMJ |
| JASOND | |
| 2008: | JFMAMJ |
| JASOND | |
| 2007: | JFMAMJ |
| JASOND | |
| 2006: | JFMAMJ |
| JASOND | |
| 2005: | OND |
Subtopics:
| Mathematics | 246 |
| Programming | 100 |
| Language | 95 |
| Miscellaneous | 75 |
| Book | 50 |
| Tech | 49 |
| Etymology | 36 |
| Haskell | 33 |
| Oops | 30 |
| Unix | 27 |
| Cosmic Call | 25 |
| Math SE | 25 |
| Law | 23 |
| Physics | 21 |
| Perl | 17 |
| Biology | 16 |
| Brain | 15 |
| Calendar | 15 |
| Food | 15 |


Comments disabled
Fri, 09 Mar 2007
Bernoulli processes
A family has four children. Assume that the sexes of the four
children are independent, and that boys and girls are equiprobable.
What's the most likely distribution of boys and girls?
Well,it depends how you count. Are there three possibilities or five?
|
|
| Boys | Girls | Probability |
|---|---|---|
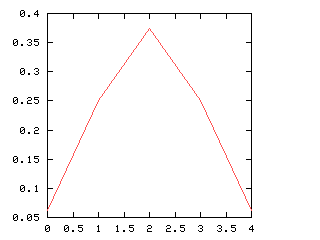
| 0 | 4 | 0.0625 |
| 1 | 3 | 0.25 |
| 2 | 2 | 0.375 |
| 3 | 1 | 0.25 |
| 4 | 0 | 0.0625 |
This distribution is depicted in the graph at right. Individually, (3, 1) and (1, 3) are less likely than (2, 2). But "three-and-one" includes both (1, 3) and (3, 1), whereas "two-and-two" includes only (2, 2). So if you group outcomes into three categories, as in the green division above left, "three-and-one" comes out more frequent overall than "two-and-two":
| One sex | The other | Total probability |
|---|---|---|
| 4 | 0 | 0.125 |
| 3 | 1 | 0.5 |
| 2 | 2 | 0.375 |
It makes a difference whether you specify the sexes in the
distribution. If a "distribution" is a thing like "b of the
children are boys and g are girls", then the most frequent
distribution is (2, 2). But if a distribution is "x of one sex
and y of the other", then the most frequent distribution [3, 1],
where I've used square brackets to show that the order is not
important. [3, 1] is the same as [1, 3].
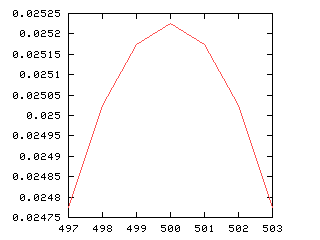
This is true in general. Suppose someone has 1,000 kids. What's the most likely distribution of sexes? It's 500 boys and 500 girls, which I've been writing (500, 500). This is more likely than either (499, 501) or (501, 499). But if you consider "Equal numbers" versus "501-to-499", which I've been writing as [500, 500] and [501, 499], then [501, 499] wins:
| Boys | Girls | Probability |
|---|---|---|
| 501 | 499 | 0.02517 |
| 500 | 500 | 0.02522 |
| 499 | 501 | 0.02517 |
| One sex | The other | Total probability |
|---|---|---|
| 501 | 499 | 0.05035 |
| 500 | 500 | 0.02522 |
|
Why is this? [4, 3, 3, 3] covers the four most frequent distributions: (4, 3, 3, 3), (3, 4, 3, 3), (3, 3, 4, 3), and (3, 3, 3, 4). But [4, 4, 3, 2] covers twelve quite frequent distributions: (4, 4, 3, 2), (4, 3, 2, 4), and so on. Even though the individual distributions aren't as common as (4, 4, 4, 3), there are twelve of them instead of 4. This gives [4, 4, 3, 2] the edge.
[5, 4, 3, 1] includes 24 distributions, and ends up tied for second place. A complete table is in the sidebar at left.
(For 5-card poker hands, the situation is much simpler. [2, 2, 1, 0] is most common, followed by [2, 1, 1, 1] and [3, 1, 1, 0] (tied), then [3, 2, 0, 0], [4, 1, 0, 0], and [5, 0, 0, 0].)
This same issue arose in my
recent article on Yahtzee roll probabilities. There we had six
"suits", which represented the six possible rolls of a die, and I
asked how frequent each distribution of "suits" was when five dice
were rolled. For distribution [p1,
p2, ...], we let ni be the
number of p's that are equal to i. Then the expression
for probability of the distribution has a factor of  in the denominator, with the result that
distributions with a lot of equal-sized parts tend to appear less
frequently than you might otherwise expect.
in the denominator, with the result that
distributions with a lot of equal-sized parts tend to appear less
frequently than you might otherwise expect.
I'm not sure how I got so deep into this end of the subject, since I didn't really want to compare complex distributions to each other so much as to compare simple distributions under different conditions. I had originally planned to discuss the World Series, which is a best-four-of-seven series of baseball games that we play here in the U.S. and sometimes in that other country to the north. Sometimes one team wins four games in a row ("sweeps"); other times the Series runs the full seven games.
You might expect that even splits would tend to occur when the two teams playing were evenly matched, but that when one team was much better than the other, the outcome would be more likely to be a sweep. Indeed, this is generally so. The chart below graphs the possible outcomes. The x-axis represents the probability of the Philadelphia Phillies winning any individual game. The y-axis is the probability that the Phillies win the entire series (red line), which in turn is the sum of four possible events: the Phillies win in 4 games (green), in 5 games (dark blue), in 6 games (light blue), or in 7 games (magenta). The probabilities of the Nameless Opponents winning are not shown, because they are exactly the opposite. (That is, you just flip the whole chart horizontally.)
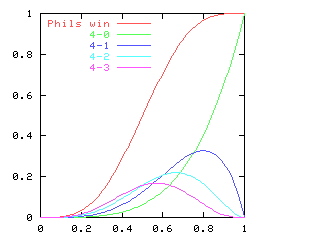
Clearly, the Phillies have a greater-than-even chance of winning the Series if and only if they have a greater-than-even chance of winning each game. If they are playing a better team, they are likely to lose, but if they do win they are most likely to do so in 6 or 7 games. A sweep is the most likely outcome only if the Opponents are seriously overmatched, and have a less than 25% chance of winning each game. (The lines for the 4-a outcome and the 4-b outcome cross at 1-(pa / pb)1/(b-a), where pi is 1, 4, 10, 20 for i = 0, 1, 2, 3.)
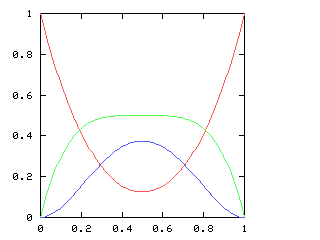
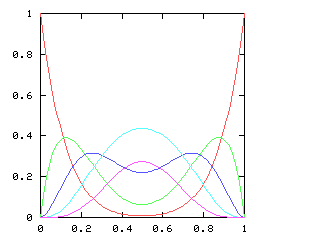
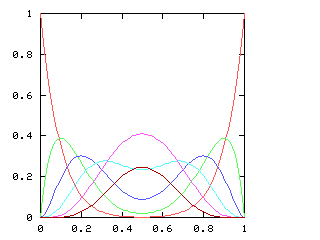
If we consider just the first four games of the World Series, there are five possible outcomes, ranging from a Phillies sweep, through a two-and-two split, to an Opponents sweep. Let p be the probability of the Phillies winning any single game. As p increases, so does the likelihood of a Phillies sweep. The chart below plots the likelihood of each of the five possible outcomes, for various values of p, charted here on the horizontal axis:
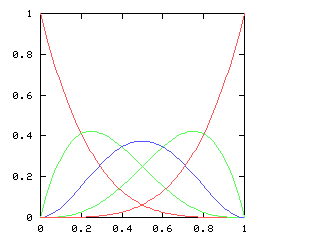
When is the 2-2 split the most likely outcome? Only when the Phillies and the Opponents are approximately evenly matched, with neither team no more than 60% likely to win any game.
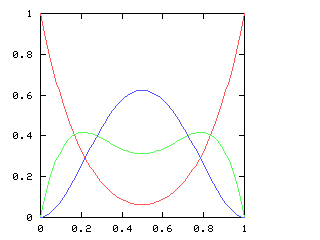
But just as with the sexes of the four kids, we get a different result if we consider the outcomes that don't distinguish the teams. For the first four games of the World Series, there are only three outcomes: a sweep (which we've been writing [4, 0]), a [3, 1] split, and a [2, 2] split:
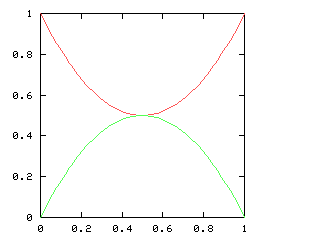
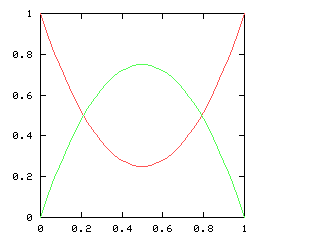
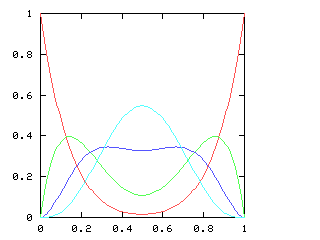
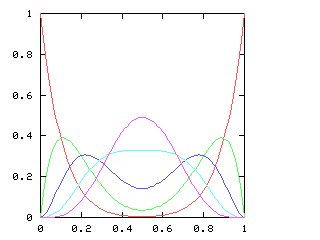
Here are the corresponding charts for series of various lengths.
| Series length (games) | Distinguish teams | Don't distinguish teams |
|---|---|---|
| 2 | 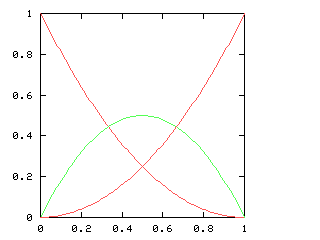
| 
|
| 3 | 
| 
|
| 4 |
|
|
| 5 | 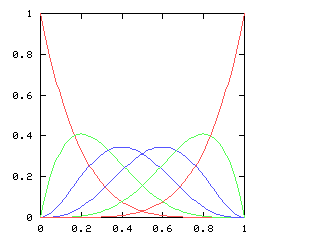
| 
|
| 6 | 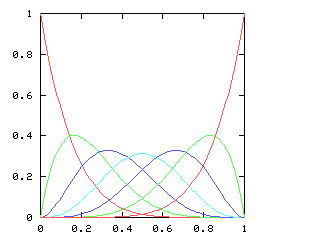
| 
|
| 7 | 
| 
|
| 8 | 
| 
|
| 9 | 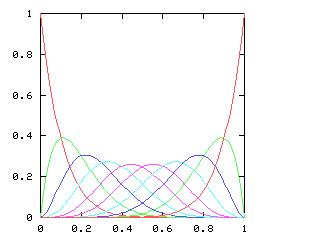
| 
|
| 10 | 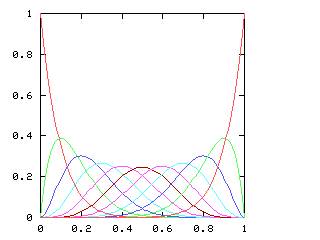
| 
|
I have no particular conclusion to announce about this; I just thought that the charts looked cool.
Coming later, maybe: reasoning backwards: if the Phillies sweep the World Series, what can we conclude about the likelihood that they are a much better team than the Opponents? (My suspicion is that you can conclude a lot more by looking at the runs scored and runs allowed totals.)
(Incidentally, baseball players get a share of the ticket money for World Series games, but only for the first four games. Otherwise, they could have an an incentive to prolong the series by playing less well than they could, which is counter to the ideals of sport. I find this sort of rule, which is designed to prevent conflicts of interest, deeply satisfying.)
[Other articles in category /math] permanent link